Solar Indices ?
Solar Indices
Key metrics measuring solar activity. High SFI and SN generally improve HF propagation, while low A and K indices mean less noise.
Key metrics measuring solar activity. High SFI and SN generally improve HF propagation, while low A and K indices mean less noise.
SFI ?
Init...
--
Solar Flux Index
Measure of 10.7cm radio noise. Higher numbers (>100) generally improve F-layer reflection on higher bands (10m-20m).
Measure of 10.7cm radio noise. Higher numbers (>100) generally improve F-layer reflection on higher bands (10m-20m).
Sunspots ?
Init...
--
Sunspot Number (SN)
Number of active regions on the Sun. Higher numbers (>100) mean better high-band (10m-15m) propagation.
Number of active regions on the Sun. Higher numbers (>100) mean better high-band (10m-15m) propagation.
A-Index ?
Init...
--
A-Index
Daily average of geomagnetic activity. Low values (<10) indicate a stable ionosphere for good communication.
Daily average of geomagnetic activity. Low values (<10) indicate a stable ionosphere for good communication.
K-Index ?
Init...
--
K-Index
Logarithmic measure of magnetic disturbance. 0-2 is quiet (Good), >5 indicates storm conditions (Noise/Flutter).
Logarithmic measure of magnetic disturbance. 0-2 is quiet (Good), >5 indicates storm conditions (Noise/Flutter).
3-Day Outlook
NOAA Forecast
Predicted maximum K-Index for the next 3 days. Helps plan future operation.
Predicted maximum K-Index for the next 3 days. Helps plan future operation.
Loading Forecast...
Space Weather
X-Ray Flux ?
X-Ray Flux
Intensity of solar flares. M-class and X-class flares cause radio blackouts on the sunlit side of Earth.
Intensity of solar flares. M-class and X-class flares cause radio blackouts on the sunlit side of Earth.
--
Normal
Wind Spd ?
--
km/s
Init...
Solar Wind Speed
Speed of particles from the Sun. High speeds (>500 km/s) can trigger geomagnetic storms.
Speed of particles from the Sun. High speeds (>500 km/s) can trigger geomagnetic storms.
Bz (Mag) ?
--
nT
Init...
Bz (Magnetic Field)
Direction of the solar wind's magnetic field. Negative values (South) allow solar particles to enter Earth's atmosphere.
Direction of the solar wind's magnetic field. Negative values (South) allow solar particles to enter Earth's atmosphere.
Proton Flux ?
Normal
Proton Flux
Density of high-energy protons. High levels cause Radiation Storms (S1-S5) which can block radio signals near the poles.
Density of high-energy protons. High levels cause Radiation Storms (S1-S5) which can block radio signals near the poles.
Aurora Forecast
Aurora Forecast
Shows the auroral oval intensity. High activity indicates Polar Cap Absorption (PCA) on HF paths.
Shows the auroral oval intensity. High activity indicates Polar Cap Absorption (PCA) on HF paths.
Polar HF

NOAA/SWPC
Global Gray Line & MUF ?
Gray Line & MUF
Shows the day/night boundary (Gray Line) optimal for low-band DX, and Maximum Usable Frequency (MUF) map for high bands.
Shows the day/night boundary (Gray Line) optimal for low-band DX, and Maximum Usable Frequency (MUF) map for high bands.
Sun Position
The Gray Line
The twilight zone where D-layer absorption drops but F-layer remains charged. Critical for long-distance (DX) communication on 160m-40m.
The twilight zone where D-layer absorption drops but F-layer remains charged. Critical for long-distance (DX) communication on 160m-40m.
Sun: --
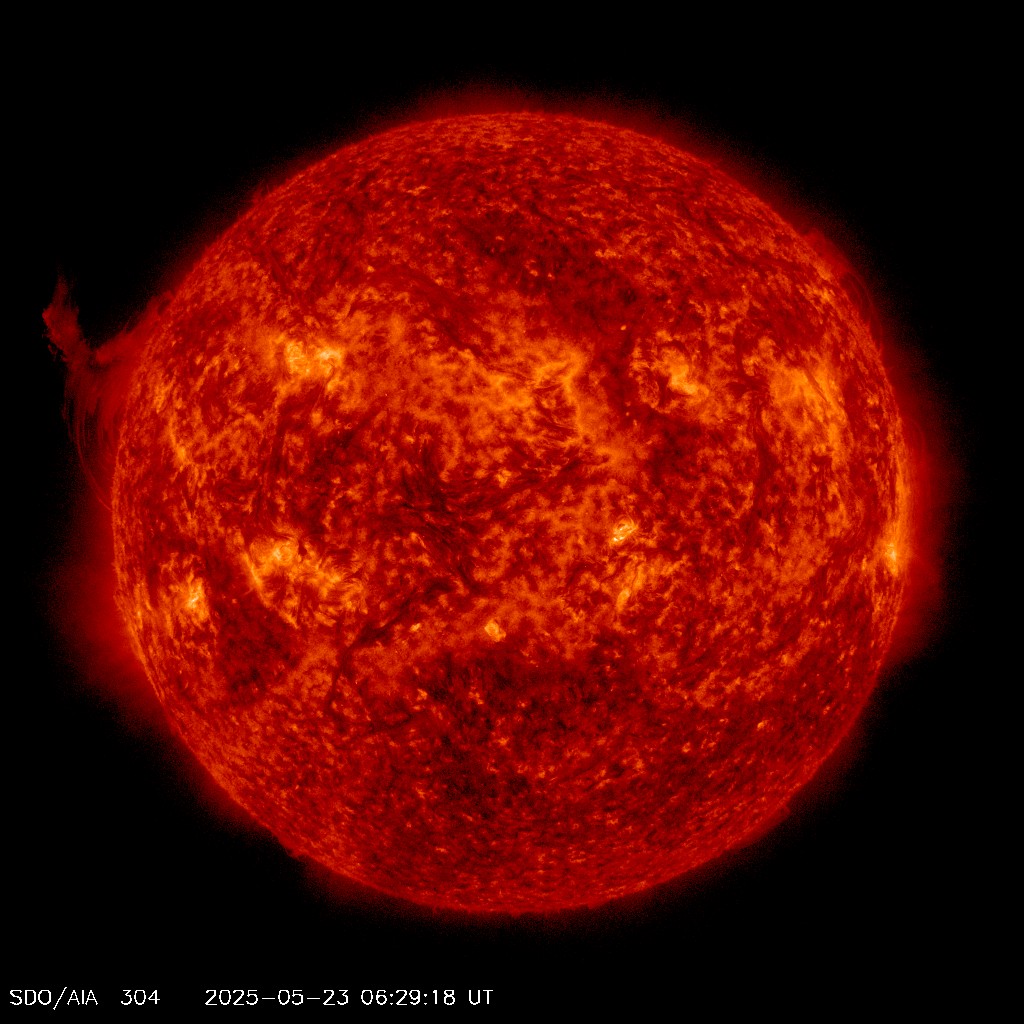
AIA 304 (Chromosphere) ?
AIA 304 Angstrom
Shows the Sun's upper atmosphere. Bright areas are active regions capable of flares. Filament eruptions appear dark.
Shows the Sun's upper atmosphere. Bright areas are active regions capable of flares. Filament eruptions appear dark.
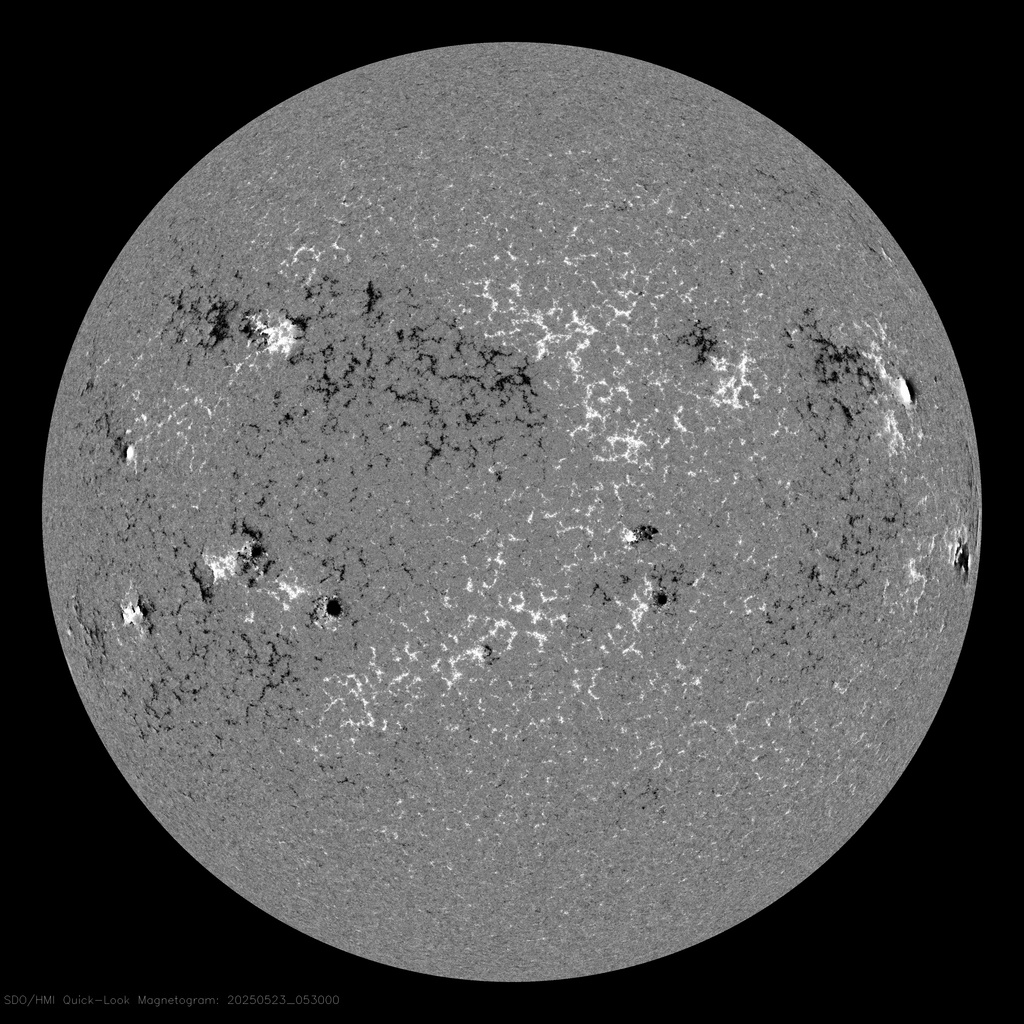
HMI Magnetogram ?
Magnetogram
Maps magnetic polarity. Black and White spots indicate opposite magnetic poles. Complex mixed areas create flares.
Maps magnetic polarity. Black and White spots indicate opposite magnetic poles. Complex mixed areas create flares.
30-Day Solar Flux
SFI Trend
Solar Flux Index history over the last 30 days. Increasing trend generally means improving HF conditions.
Solar Flux Index history over the last 30 days. Increasing trend generally means improving HF conditions.
AI Propagation Briefing
AI Analysis
Generates a custom propagation report using Google Gemini based on live solar data.
Generates a custom propagation report using Google Gemini based on live solar data.
Click "Generate Report" to request an AI analysis of current band conditions.
Propagation Prediction ?
Propagation Forecast
Estimated conditions for amateur radio bands based on real-time solar flux and geomagnetic indices.
Estimated conditions for amateur radio bands based on real-time solar flux and geomagnetic indices.
Estimates based on current SFI & K-Index
| Band | Day | Night |
|---|
Anomalies ?
Space Weather Anomalies
Specific conditions like "10m OPEN" (high SFI) or "Auroral Flutter" (high K-Index) that affect radio propagation.
Specific conditions like "10m OPEN" (high SFI) or "Auroral Flutter" (high K-Index) that affect radio propagation.
Scanning ionosphere...